Lansing Auto Accident Statistics
Car accidents frequently happen when least expected, whether it’s a Lansing auto accident or a collision elsewhere in Michigan. It’s a simple fact that certain roadways are busier and, therefore, more dangerous than others.
In the riskier driving areas, motorists must pay extra attention to their own behavior behind the wheel, particularly cell phone use, which is a leading cause of distracted driving accidents. Also, when traveling through congested areas, motorists must be aware of other vehicles sharing the roadway and the actions of other drivers.
In particular, large trucks can present challenges for motorists in smaller passenger vehicles. For example, perhaps the large truck is traveling too fast for weather conditions or the semi-truck driver is fatigued, both of which can significantly increase the chance of a semi-truck accident.

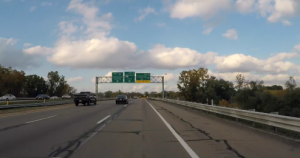
Lansing’s I-496 and US-127 interchange.
As a way to draw attention to certain Michigan dangerous roads, the Sinas Dramis Law Firm launched an “Understanding Dangerous Roads” public awareness campaign. In addition to identifying roads that are particularly risky due to heavy traffic, numerous exit/entrance ramps, lane mergers and shifting traffic patterns, the campaign also offers tips for safely navigating the designated areas to help prevent Michigan car accident injuries.
The first phase of the campaign spotlights dangerous roadways and intersections in mid-Michigan, including Lansing. Crash reports and statistics show there is an especially high occurrence of Lansing auto accidents on I-496 and US-127 and also a high rate of accidents on I-94 and US-127 around Jackson, just south of Lansing.
Dangerous intersections and roadways in Lansing, Michigan
- Grand River Ave. and Hagadorn Rd. – 68 crashes in 2016 *
- East Jolly Rd. and South Cedar St. – 35 crashes in 2016
- West Michigan Ave. and South Brown St. – 19 crashes in 2016
- BUS 127 (North West Ave.) and West North St. – 22 crashes in 2016
- West Saginaw Hwy and South Waverly Rd. – 30 crashes in 2016
- West Saginaw Hwy and North Canal Rd. – 30 crashes in 2016
- West Saginaw Hwy and Elmwood Rd. – 33 crashes in 2016
- I-496 and US-127 corridor – 186 crashes in 2016
* most recent statistics available
Lansing, Michigan crash statistics
The Michigan Office of Highway Safety Planning compiles traffic accident figures for the state of Michigan. Here are the most recent Lansing auto accident statistics.
Ingham County (2016)
- Total number of crashes: 9,947
- 22,275 motor vehicle drivers and passengers
- 114 bicyclists
- 91 pedestrians
- Greatest number of accidents occurred in these municipalities:
- Lansing – 4,360 crashes
- East Lansing – 1,540 crashes
- Meridian Township – 988 crashes
- The highest number of fatal crashes and fatalities occurred in September.
- Motorcycles were involved in 0.84% of total vehicles in crashes, but were involved in 25% of total fatal crashes.
Eaton County (2016)
- Total number of crashes: 3,368
- 6,126 motor vehicle drivers and passengers
- 15 bicyclists
- 11 pedestrians
- Greatest number of crashes occurred in these municipalities:
- Delta Township – 1,200 crashes
- Windsor – 308 crashes
- Charlotte – 259 crashes
- The highest number of fatal crashes and fatalities occurred in March, April, June and October (2 fatal crashes each).
If you’ve been injured in a Lansing auto accident, contact our Michigan car accident attorneys today to help protect your right to insurance benefits and compensation.
[button url=”https://sinasdramis.com/contact-sinas-dramis-law-firm” class=”button” size=”small” color=”royal-blue” target=”_self” lightbox_content=”” lightbox_description=””] Free Consultation [/button]
